systemcalls
最近工作太忙了,好久没有时间更新学习进度了,本周还是抽时间把lab2的内容作完了,lab2的难度感觉比lab1小多了,主要是为系统添加两个system call,总体来说难度偏低。
- 首先我们可以观察到,所有的系统调用函数都存放在
usys.S中,用risc-v的指令完成。在用户空间中调用系统调用函数func,实际内核中对应的就是系统调用对应的id写入到寄存器a7,然后调用ecall指令,即在内核中可调用对应的函数。
.global fork
fork:
li a7, SYS_fork
ecall
ret
.global exit
exit:
li a7, SYS_exit
ecall
ret
.global wait
wait:
li a7, SYS_wait
ecall
ret
.global pipe
pipe:
li a7, SYS_pipe
ecall
ret
.global read
read:
li a7, SYS_read
ecall
ret
.global write
write:
li a7, SYS_write
ecall
ret
.global close
close:
li a7, SYS_close
ecall
ret
.global kill
kill:
li a7, SYS_kill
ecall
ret
.global exec
exec:
li a7, SYS_exec
ecall
ret
.global open
open:
li a7, SYS_open
ecall
ret
.global mknod
mknod:
li a7, SYS_mknod
ecall
ret
.global unlink
unlink:
li a7, SYS_unlink
ecall
ret
.global fstat
fstat:
li a7, SYS_fstat
ecall
ret
.global link
link:
li a7, SYS_link
ecall
ret
.global mkdir
mkdir:
li a7, SYS_mkdir
ecall
ret
.global chdir
chdir:
li a7, SYS_chdir
ecall
ret
.global dup
dup:
li a7, SYS_dup
ecall
ret
.global getpid
getpid:
li a7, SYS_getpid
ecall
ret
.global sbrk
sbrk:
li a7, SYS_sbrk
ecall
ret
.global sleep
sleep:
li a7, SYS_sleep
ecall
ret
.global uptime
uptime:
li a7, SYS_uptime
ecall
ret
.global trace
trace:
li a7, SYS_trace
ecall
ret
.global sysinfo
sysinfo:
li a7, SYS_sysinfo
ecall
ret// System call numbers
- 在内核中我们可以看到实际的系统调用内核中执行如下:
从a7寄存器中取出系统调用号,然后执行对应的内核中的函数,系统调用函数可能会从用户空间中取出传入的参数,然后将执行的返回结果再写回到用户空间中。void
syscall(void)
{
int num;
struct proc *p = myproc();
// system call number
num = p->trapframe->a7;
if(num > 0 && num < NELEM(syscalls) && syscalls[num]) {
p->trapframe->a0 = syscalls[num]();
if(p->tracemask & (1<<num)){
// printf("sys call num = %d\n",num);
printf("%d: syscall %s -> %d\n",p->pid,syscallname[num],p->trapframe->a0);
}
} else {
printf("%d %s: unknown sys call %d\n",
p->pid, p->name, num);
p->trapframe->a0 = -1;
}
} - 如果我们需要添加系统调用,则首先添加系统调用的编号,然后在内核中添加系统调用编号对应的回调函数即可。
- 测试结果:
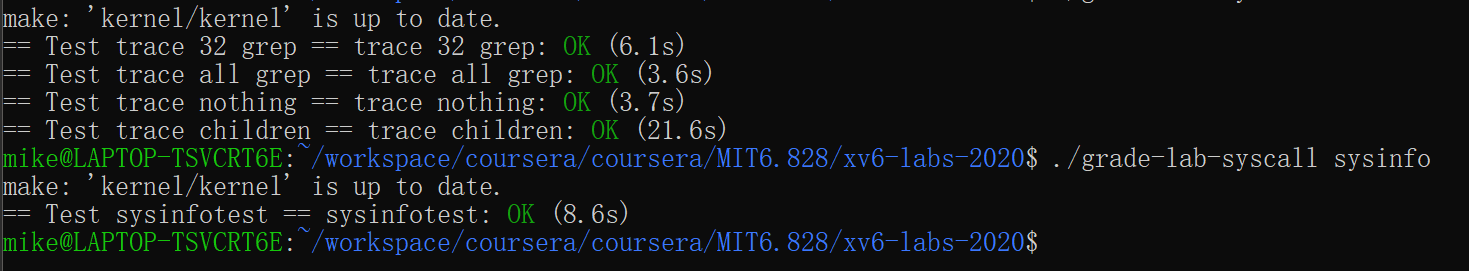
1. trace
In this assignment you will add a system call tracing feature that may help you when debugging later labs. You’ll create a new trace system call that will control tracing. It should take one argument, an integer “mask”, whose bits specify which system calls to trace. For example, to trace the fork system call, a program calls trace(1 << SYS_fork), where SYS_fork is a syscall number from kernel/syscall.h. You have to modify the xv6 kernel to print out a line when each system call is about to return, if the system call’s number is set in the mask. The line should contain the process id, the name of the system call and the return value; you don’t need to print the system call arguments. The trace system call should enable tracing for the process that calls it and any children that it subsequently forks, but should not affect other processes. |
实现系统调用的trace功能,即打印出进程中每一个在mask掩码中的系统调用,并且子进程会继承父进程的mask.
- 代码实现本身不是特别难,主要是需要弄清楚系统的调用的过程。我们首先添加系统调用编号在用户程序中添加如下:在进程的结构体中增加
entry("sleep");
entry("uptime");
entry("trace");
entry("sysinfo");tracemask变量,在systemcall函数中需要修改,每次进行系统调用时,则将系统调用号与掩码进行比对,是否存在于掩码的状态中,如果掩码存在,则此时我们打印出系统调用的具体信息。本身不是特别难。void
syscall(void)
{
int num;
struct proc *p = myproc();
num = p->trapframe->a7;
if(num > 0 && num < NELEM(syscalls) && syscalls[num]) {
p->trapframe->a0 = syscalls[num]();
if(p->tracemask & (1<<num)){
// printf("sys call num = %d\n",num);
printf("%d: syscall %s -> %d\n",p->pid,syscallname[num],p->trapframe->a0);
}
} else {
printf("%d %s: unknown sys call %d\n",
p->pid, p->name, num);
p->trapframe->a0 = -1;
}
}
代码
// system trace call, using trace mask to print system call information |
2. sysinfo
In this assignment you will add a system call, sysinfo, that collects information about the running system. The system call takes one argument: a pointer to a struct sysinfo (see kernel/sysinfo.h). The kernel should fill out the fields of this struct: the freemem field should be set to the number of bytes of free memory, and the nproc field should be set to the number of processes whose state is not UNUSED. We provide a test program sysinfotest; you pass this assignment if it prints “sysinfotest: OK”. |
完成sysinfo系统调用,主要时获取当前heap中的free的总空间,同时获取当前系统中存在多少非空闲的进程个数。这个也比较简单,难点在于学会将内核空间的数据拷贝到用户空间。
- 系统调用添加的流程跟
trace是一样的,稍微复杂点即是需要在kalloc.c中添加对free memory的统计,以及在proc中添加对空闲进程的统计。 kalloc中我们可以看到所有的memory free是用list表示的,每一块空闲的内存大小为4096 byte,我们只需要遍历freelist统计块的数目即可。proc中我们可以看到每一个process都有一个状态,我们只需要检测process的状态即可,process列表用数组表示,我们只需要遍历数组即可。- 关键的一点,获取参数以后,需要将所有的参数信息从内核空间拷贝到用户空间即可,这时需要用到
copyout函数.int sysinfo(uint64 addr){
struct proc *p = myproc();
struct sysinfo st;
st.freemem = totalfree();
st.nproc = nproc();
// printf("total free: %d\n",st.freemem);
// printf("total proc:%d\n",st.nproc);
if(copyout(p->pagetable, addr, (char *)&st, sizeof(st)) < 0)
return -1;
return 0;
}
代码
// system information null process number. |
欢迎关注和打赏,感谢支持!
- 关注我的博客: http://mikemeng.org/
- 关注我的知乎:https://www.zhihu.com/people/da-hua-niu
- 关注我的微信公众号: 公务程序猿

扫描二维码,分享此文章